← Back to projects
Excel + VBA

Coffee Sales Dashboard

An interactive Excel dashboard built from 1,000 coffee order records covering January 2019 to August 2022. The dataset includes customer, product, coffee type, roast type, size, country, quantity, pricing, and sales information. Slicers and a timeline filter every chart at once, and a VBA macro audits the raw data for quality issues.

1,000
Order line items
$45,135
Total sales
3
Countries
2019–22
Jan 2019 – Aug 2022
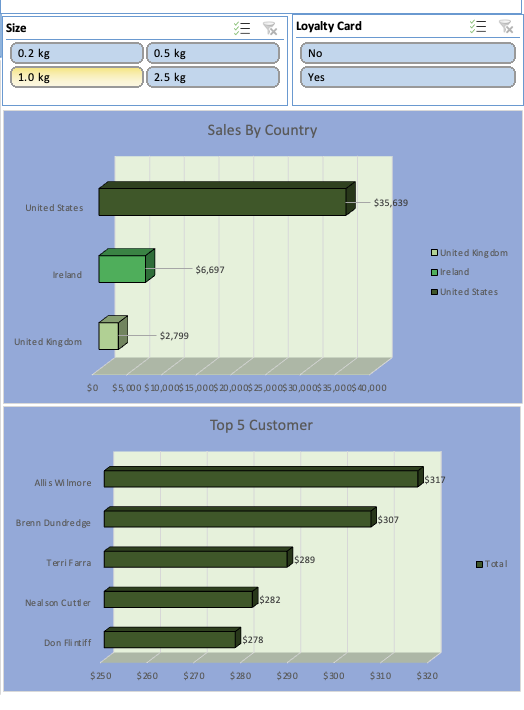
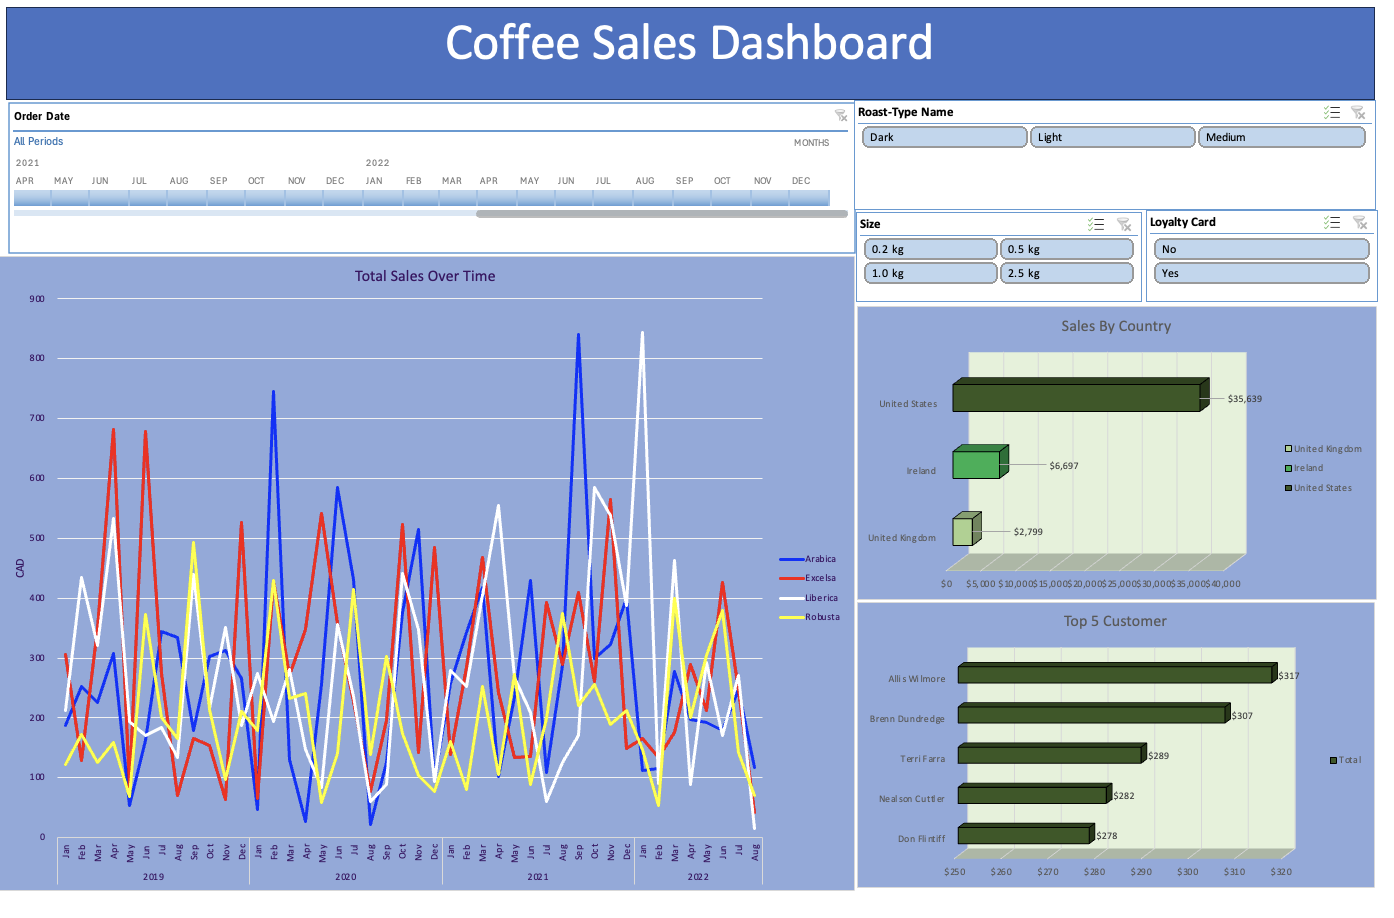
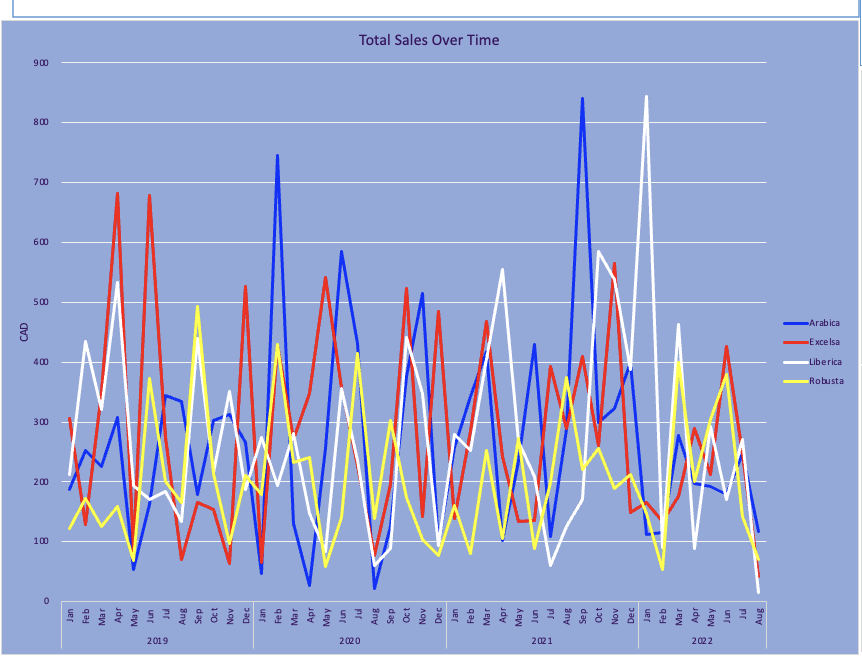
Excel dashboard with a timeline and slicers for roast type, size and loyalty card, a line chart of monthly sales by coffee type, a bar chart of sales by country, and a bar chart of the top five customers.
The full dashboard. Click to open full size.

How I built it

01 · Combine

Join the tables

Pulled customer details and product details from separate sheets into each order row with XLOOKUP, and calculated sales per line (unit price × quantity).

02 · Analyze

Summarize with pivots

Built pivot tables for sales over time, by country, by coffee type, roast and size, and for the top five customers.

03 · Visualize

Build the dashboard

Turned the pivots into charts on one dashboard sheet, then connected slicers and a timeline so every chart filters together.

04 · Validate

Audit with a macro

Wrote a VBA macro that checks every order row for missing, duplicate and invalid values and logs each problem to an Exceptions sheet.

What the data shows

~79%
United States leads revenue

The US generated about $35,639 in sales, well ahead of Ireland ($6,697) and the United Kingdom ($2,799).

$23,786
2.5 kg is the top size

The largest bag size brought in more than half of total sales.

$17,354
Light roast sells best

Light roast generated the highest sales of the three roast types.

$12,306
Excelsa is the top coffee type

Excelsa led the four coffee types in sales.

Feb 2020
Peak month

The highest monthly sales in the period, at about $1,798.
Excel skills used

XLOOKUP / lookup functions
Combined customer and product information from separate tables into the order data.
Pivot tables
Analyzed sales by country, coffee type, roast type, size, and customer.
Pivot charts
Visualized sales trends over time and comparisons across countries and customers.
Slicers & timeline
Interactive filtering by roast type, size, loyalty card status, and order date. Every chart updates together.
Data cleaning & formatting
Organized the raw order data and calculated sales for each line item.
VBA macro (data validation)
Automated a data quality audit across all 1,000 rows — see the results below.

Charts in detail

Auditing the data with a VBA macro

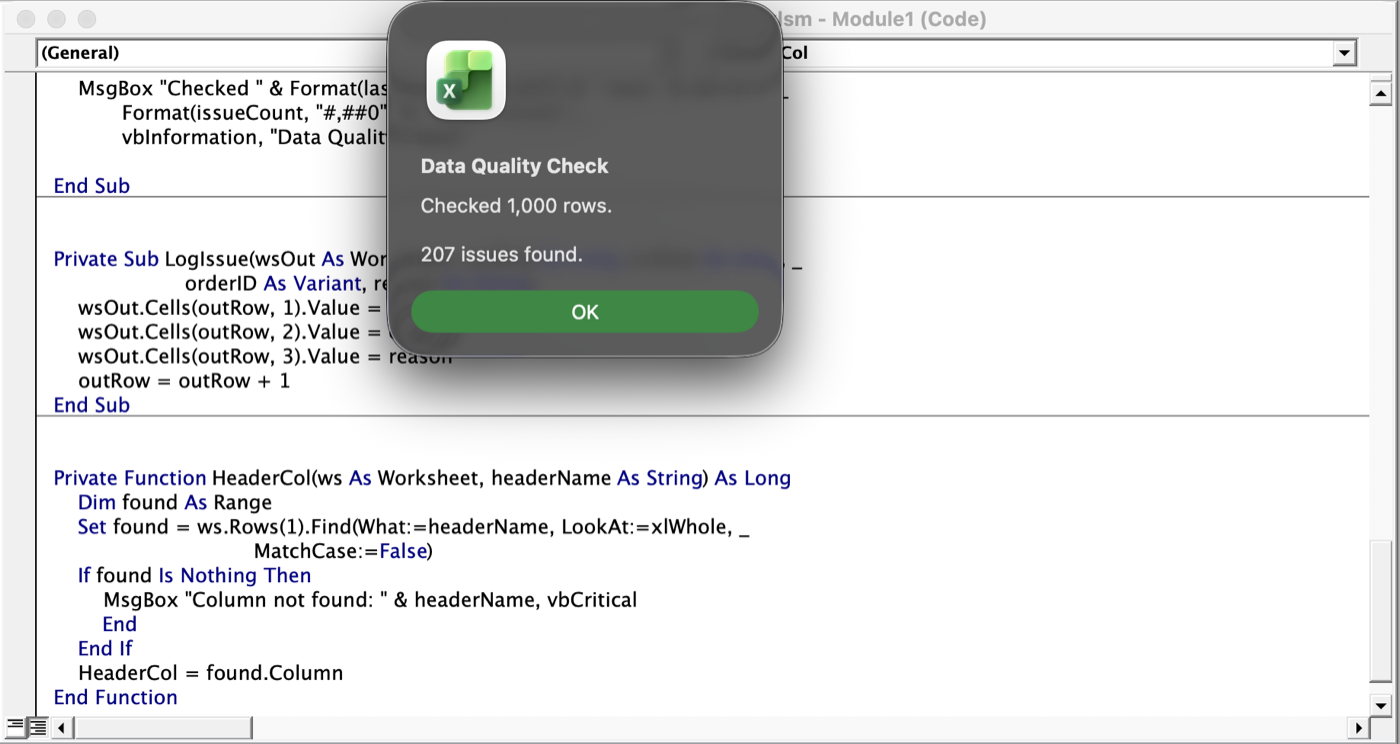
Before trusting the dashboard, I wrote a macro (CheckDataQuality) that reads every row of the orders sheet, runs five checks, and writes each problem — row number, Order ID and reason — to a new Exceptions sheet. It finds columns by their header names, so it keeps working if the column order changes.

CheckIssues
Missing email addressCustomer email blank after the lookup206
Duplicate order lineSame Order ID and same Product ID twice1
Quantity not a number, zero or negative0
Order date missing or invalid0
Order date in the future0
Total · 1,000 rows checked207
What the results mean: the 207 issues sit on 200 different orders. Missing emails don't change any sales figures, but they matter for customer follow-up and loyalty marketing. Quantities and dates were all clean, so the totals on the dashboard rest on valid numbers.
The duplicate: order NOP-21394-646 lists the same product (L-D-2.5) on two lines, with quantities of 2 and 3. That's likely one purchase of 5 split in two — worth merging so per-product line counts aren't inflated.
Also noted: the workbook has 1,000 order rows but 957 unique Order IDs, because some orders contain more than one product. Each row is a line item, so totals are summed across line items. Customer names and contact details are sample data, not real people.
The Excel VBA editor showing the CheckDataQuality macro, with a result message reading: Checked 1,000 rows. 207 issues found.
The macro in the VBA editor, and its result: 1,000 rows checked, 207 issues found.

Explore it yourself

.xlsx

Dashboard workbook

The dashboard, pivot tables and formulas. No macros, so it opens anywhere without warnings.

  • Use the slicers and timeline to filter every chart
  • See the XLOOKUPs and pivot tables behind it
Download .xlsx ≈ 380 KB
.xlsm · macro-enabled

Workbook + data quality macro

Everything in the dashboard workbook, plus the VBA macro and the Exceptions sheet it produced.

  • Excel will show a security warning — click Enable Content to run the macro
  • Run CheckDataQuality from View → Macros (Windows) or Tools → Macro → Macros (Mac)
  • Needs desktop Excel; macros don't run in Excel for the web or Numbers
Download .xlsm ≈ 400 KB · the macro only reads the sheet and writes the Exceptions tab